Payments is an ultra-competitive space, and anything that can give you an edge is worth pursuing. It’s also a data-rich space, with enormous amounts of information being generated by your merchants’ daily activities. That data is a strategic advantage — if you can capture and use it better than your competitors.
Better analytics and insights give you a deeper understanding of your merchants and their processing behavior. With that understanding you can identify new opportunities to serve them better and drive greater profitability.
Unfortunately, most payments companies underutilize analytics and fail to maximize the value of their data, mostly because there is so much information, it’s hard to know where to start looking.
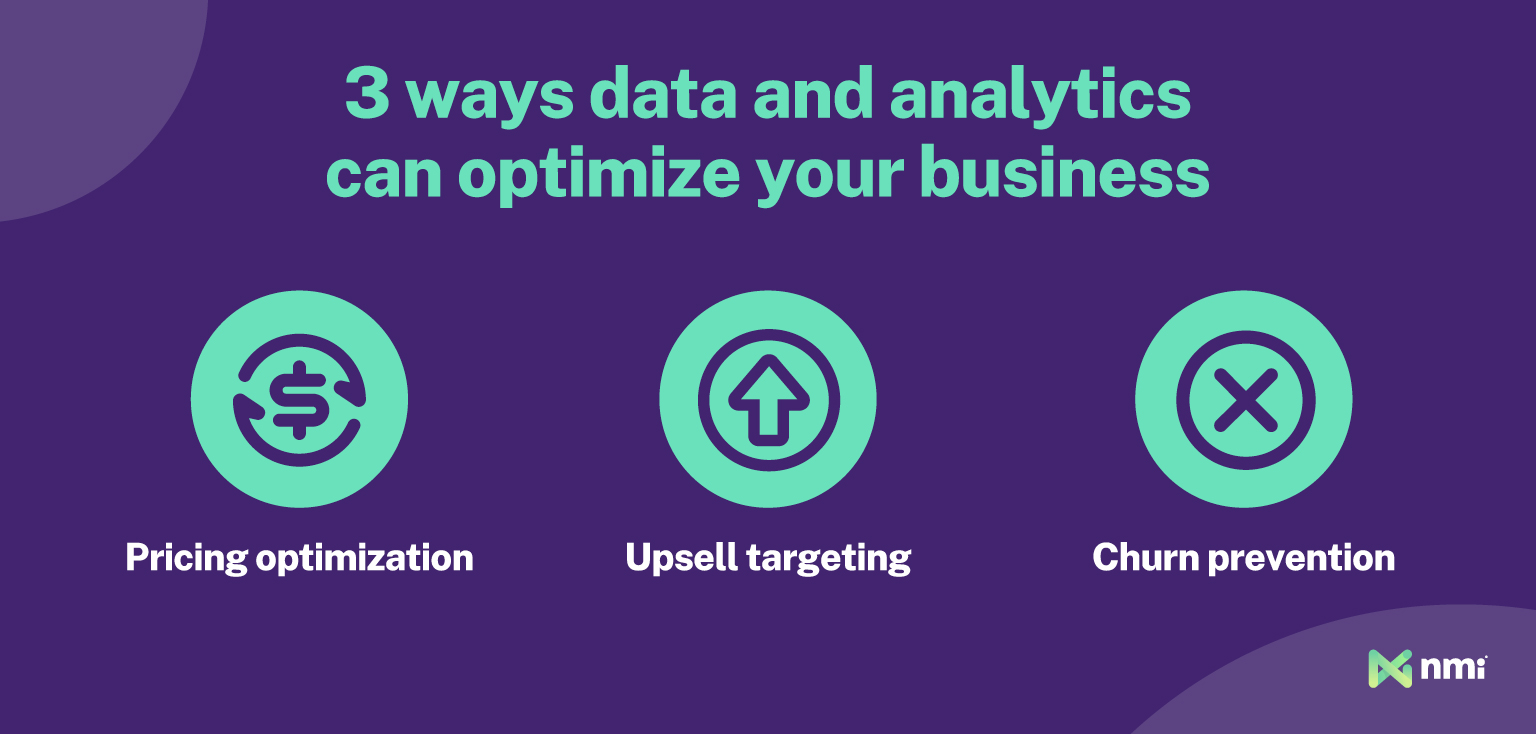
In this article, I’d like to help you break that paralysis by outlining some of the ways you can use your merchant data to open up three big opportunities:
- Pricing optimization: Setting the best possible rates for each account while maintaining value
- Upselling: Finding opportunities to sell value-added extensions that boost your revenue
- Preventing churn: Extending the life of your merchant relationships and stabilizing your portfolio
The ocean of data generated by your operations already holds the potential to drive greater value. The challenge lies in knowing how to harness it.

Opportunity 1: Pricing Optimization
Getting merchant pricing right is critical to maintaining profitability, offsetting risk and driving growth. It’s a dynamic factor that needs to evolve over time alongside your business and your merchants.
Unfortunately, under-optimized pricing can be a problem:
- Pricing too low leaves money on the table, hurting your profitability and your capacity for growth
- Pricing too high is a major driver of churn that could push your merchants into the arms of cheaper competitors
To ensure portfolio-wide pricing stays in the Goldilocks zone, you should constantly be looking for opportunities to optimize mispriced merchants. And it’s important to stay proactive because the longer you treat pricing as static (and the larger your portfolio grows), the more complex repricing becomes.
Luckily, analytics can make optimizing merchant pricing a much simpler task. By filtering and comparing the right data points, you can zero in on indicators that will help determine whether a merchant’s fees are too low, too high, or just right.
Using Analytic Indicators to Identify Repricing Opportunities
There are dozens of data points you can use to refine pricing. But, to make it simple, look for analytics that tell you a few key things:
- How a merchant’s pricing compares to similar merchants, both internally and externally
- Which merchants represent the most extreme outliers in your pricing model
- How likely a merchant is to accept a change to their current pricing
- Merchants whose margins have not been properly adjusted for evolving risk
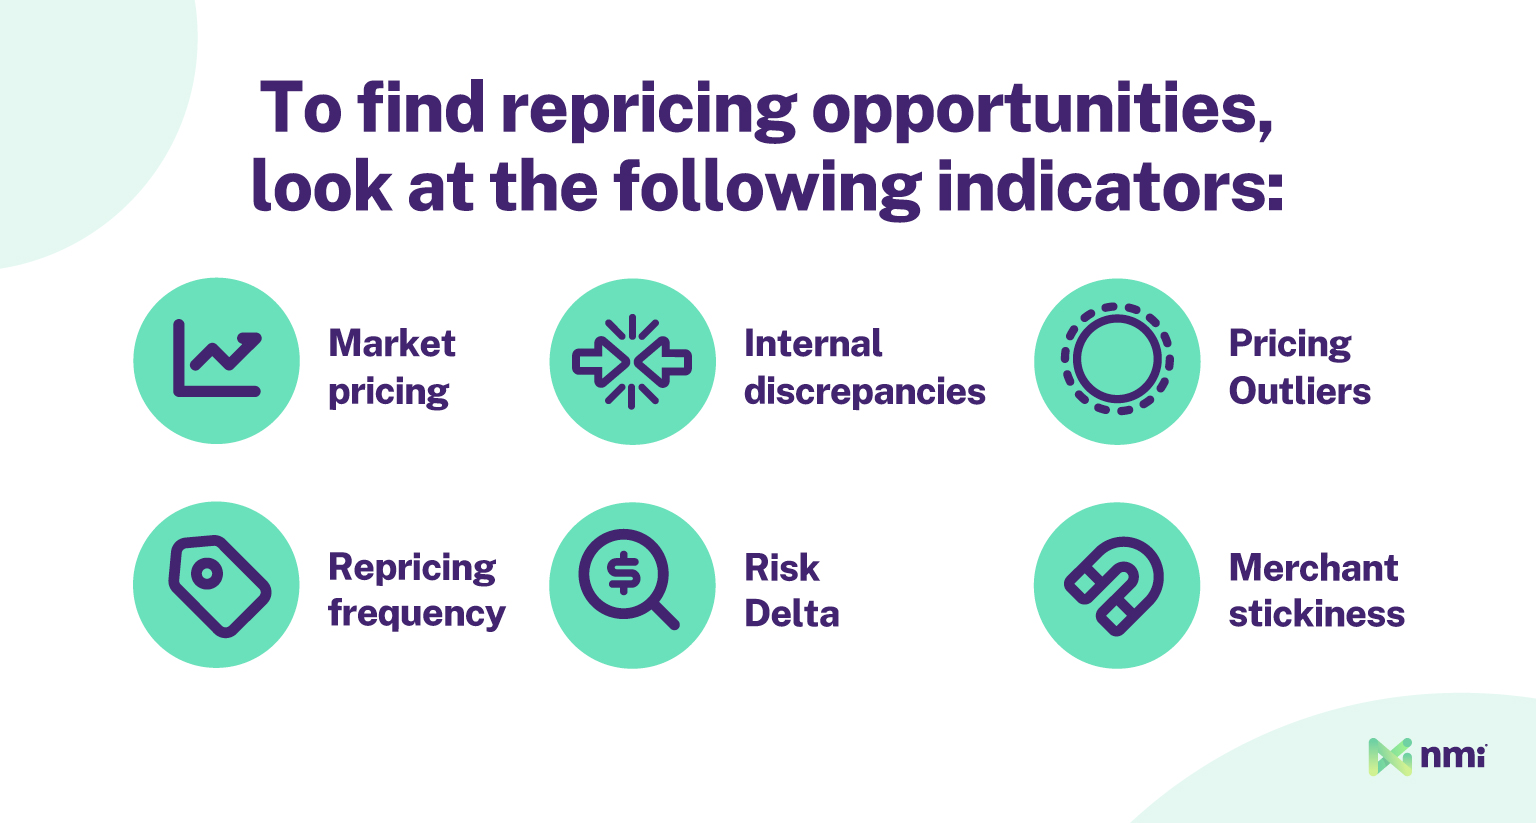
Just some of the data points you can analyze include:
Market pricing: What would you charge a merchant if they walked in the door now? What are your competitors charging? Your data can tell you which of your merchants are priced above or below where the market would price them today. For even more accuracy, you can run the same comparison with additional filters like MCC (merchant category code), transaction volume, risk profile and more.
Internal discrepancies: One valuable insight your data can provide you is discrepancies between clusters of similar merchants within your portfolio. For example, you might notice that medical clinics happily pay you a higher rate than you charge dental clinics. But, there is enough similarity between the two that rolling out a price increase to your dental clients may close the gap with minimal fuss.
Pricing outliers: Most of your mispriced merchants will be just outside where you need them to be, which is why optimizing pricing can be such a challenging task. But it isn’t uncommon for the occasional merchant to wind up significantly mispriced. The longer you operate, the more likely it is that significant outliers will emerge. Analytic filters make it easy to detect these outliers, enabling you to either reprice them or, if necessary, move on from the account.
Repricing frequency: How many times has a merchant already been repriced? Long-term merchants that have been repriced less frequently or less recently are at a higher risk of underpricing, while merchants that have already been repriced more often are likely to be resistant to additional increases.
Risk delta: When your merchants go through underwriting, most systems will assign them a risk score based on dozens of factors. As they sell, grow and evolve over time, their risk profile changes. Periodic re-underwriting provides new risk scores, which can be analyzed to determine if there is an upward or downward trend. Merchants with significant trends are an easy target for repricing.
Merchant stickiness: You can build a profile of how sticky a merchant is by manually capturing data on things like good and bad service calls, satisfaction survey scores, inquiries about new pricing or services, etc. The happier your profile tells you a merchant is, the more likely they are to accept reasonable pricing changes.

Opportunity 2: Targeted Upsell Opportunities
There is far more to selling payments than just transaction processing, and how effectively you upsell value-added services has a big impact on your monthly residuals. From advanced fraud protection to cutting-edge security to billing integrations and beyond, there is a long list of services you can sell to boost your revenue. The challenge is determining which merchants are the most likely to adopt them.
Merchant data is an ideal tool to help you find highly qualified upsell opportunities. It can help you zero in on which merchants are a good fit for a value-added extension and indicate how likely they are to convert on an offer. It can also help your sales team refine their pitch messaging to maximize the chance of a successful upsell.
Using Data to Find Common Upsell Opportunities
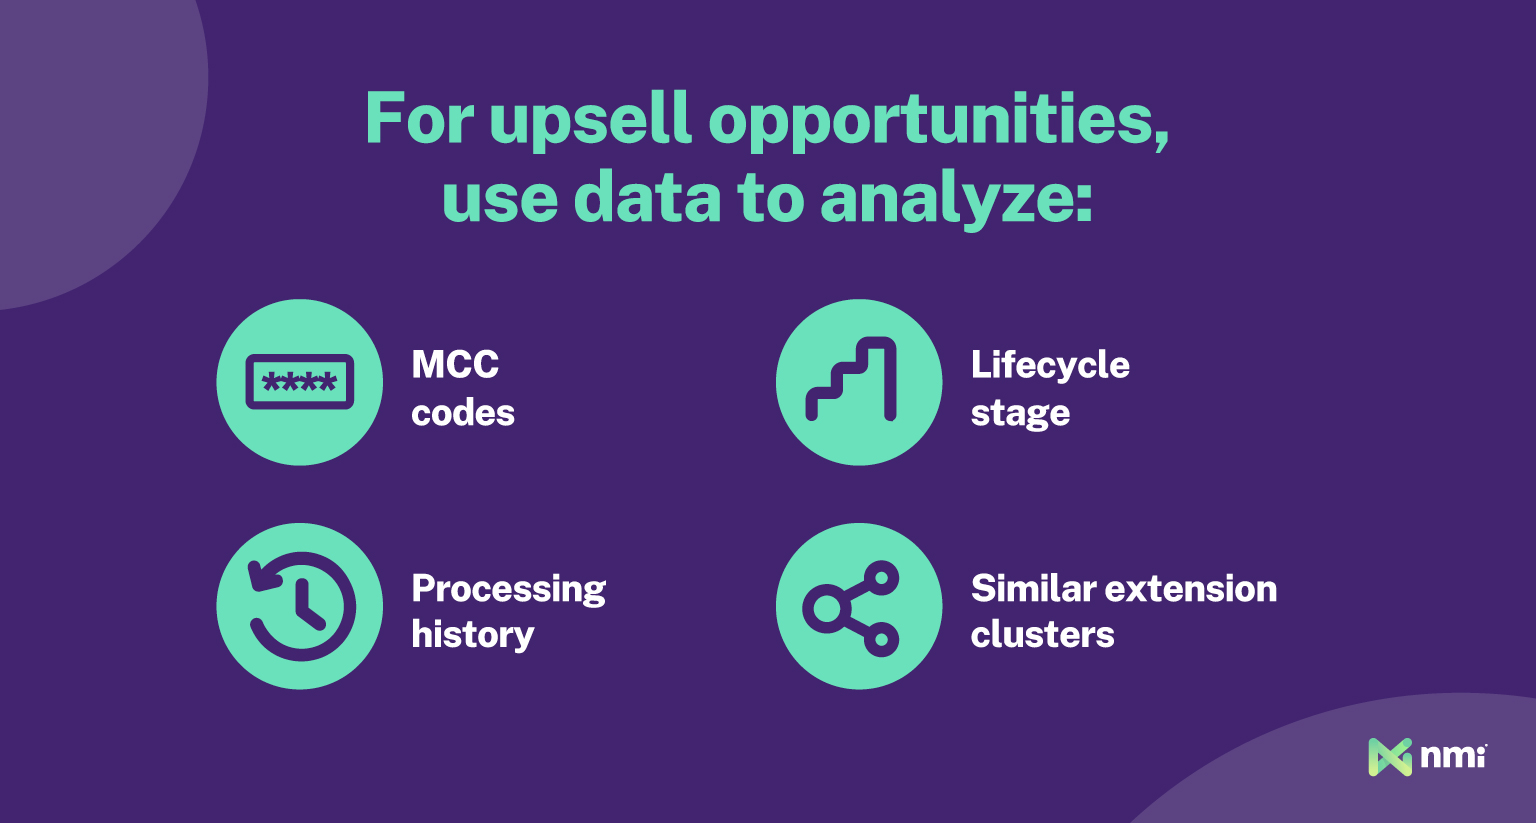
Identifying upsell opportunities is all about finding merchants with a clearly defined gap in their service that could be filled with one of your value-added extensions. Digging into your analytics can make finding those under-served needs a fast, efficient process. Areas to examine include:
MCC codes: Group your customers by merchant category code or other similar industry categories, and then examine the most commonly used value-added extensions. Merchants within a group that aren’t using a high-adoption extension may be missing out on a service that benefits their vertical.
Lifecycle stage: Where a merchant is in their growth journey can have a big impact on what kinds of add-on services they need. For example, startups are more likely to be bootstrapped, while established merchants have more budget and need for things like advanced security, mobile payments, marketplace integrations, etc. Scaling merchants are more likely to be transitioning into more complex business models that need additional services. Try filtering your analytics to find high-value and high-growth merchants using fewer extensions.
Processing history: Your merchants’ transaction history may show patterns favoring certain extensions. For example, do they process a lot of recurring transactions? Maybe they’re an ideal candidate for tokenization or automatic card updating. Are they struggling with chargebacks? Offer them AI-powered fraud protection. Transaction history can say a lot about what types of services a merchant would benefit from the most.
Similar extension clusters: Your analytics can reveal clusters of extensions that are used together most frequently. For example, you may find that merchants who use a combination of tokenization and automatic card updating are also statistically likely to use subscription management tools, as well. By identifying that cluster, you can filter for merchants who use the first two extensions but not the third — revealing a list of high-yield upsell targets.

Opportunity 3: Churn Prevention
It’s more cost-effective to keep an existing customer than to acquire a new one — that universal rule means churn is bad in every industry. But it’s especially bad in payments, where the stability and average age of your portfolio have a major impact on its value. That makes minimizing merchant turnover a critical aspect of running a successful payments company.
One common mistake is assuming that price is the driver of churn. It’s definitely an important factor, but churn risk is more holistic in nature — impacted just as much by the quality of your merchants’ experience as it is by their pricing.
The good news is you can reduce churn risk through education and service improvements — but only if you can identify the merchants who are most likely to leave. To do that, you need a holistic picture of a merchant’s processing experience, and your historical merchant data makes that possible.
Churn Factors That Can Be Identified from Merchant Data Patterns
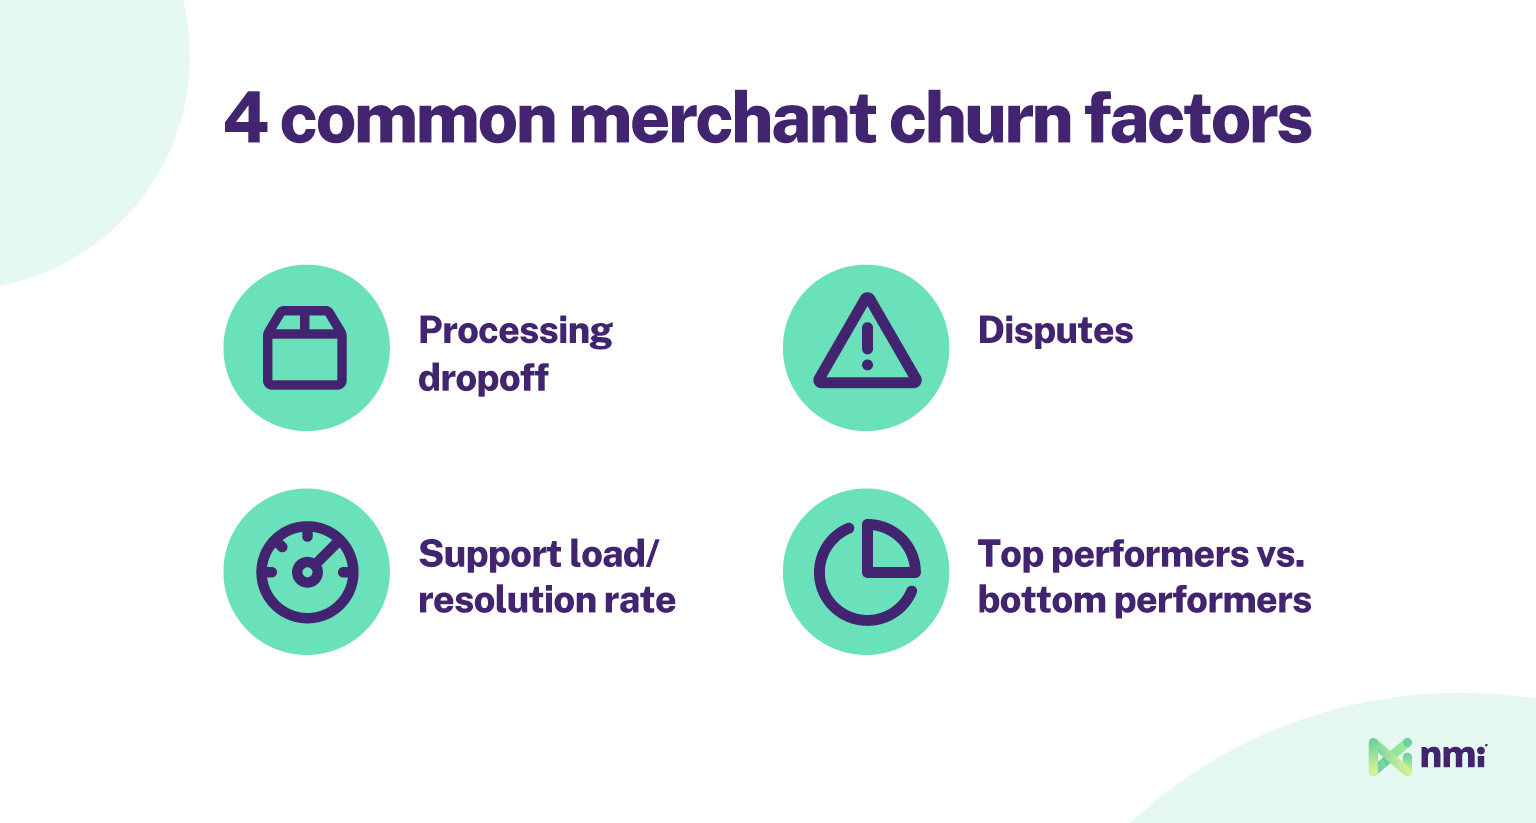
Processing dropoff: One indicator of potential churn risk is a dropoff in payment processing. Merchants whose volume and transaction amounts are trending down over time might be at a higher risk of leaving.
Disputes: Merchants struggling with friendly fraud are losing money, which naturally damages their experience. This represents not only an upsell opportunity for fraud prevention add-ons but also a potential churn driver if the problem isn’t addressed. Monitoring dispute analytics can identify opportunities for straightforward improvement.
Support load/resolution rate: One way to tell how your merchants’ experience is going is by examining support requests and resolution rates. If a merchant is constantly engaging support, they’re probably not happy. Education or an adjustment of services may be all it takes to solve the problem, but you need to identify it first.
Top performers vs. bottom performers: Merchants struggling to sell have elevated churn risks. But most poor performers are trying in earnest to succeed, and some could even be top performers with a little help. Your data can identify which of your merchants are thriving and which are struggling and, equally importantly, give clues as to why.

Capturing, Organizing and Utilizing the Data You Need to Thrive
Merchant data is one of the most valuable assets your business owns — but only if you use it. Optimized pricing, maximized upsell revenue and minimized merchant churn are three significant benefits your data can offer you, but there is almost no aspect of your operations that can’t be improved through better use of your data and analytic tools.
But one of the hardest parts of squeezing more value out of data is sorting the information you need from the information you don’t. And that friction is enough to stop many of your competitors from fully realizing the potential of their data as a competitive advantage. But it doesn’t need to stop you.
Good analytics and reporting tools make capturing, organizing and analyzing data fast and easy. By automating data capture and offering clearer, easier-to-digest reports, the right tools make it easy to put data-driven insights at the heart of all your key processes.
To learn more about how our tools can improve your data and reporting, reach out to a member of our team.


